I’m sure most of you already know not to believe pretty much anything you see online. But, even the wariest of us can still occasionally trip up and, every once in a while, take something on faith. Today, I present three examples of why you should stop doing that.
Here’s the first.
Take Off
I saw an article the other day about a paving project at our local airport. It’s going to cost just over $40M. Hmm. That seems like a lot of money. I started wondering what that would work out to be on a per landing basis over the lifespan of the new pavement. Which, I’m going to take a guess and say is five years.
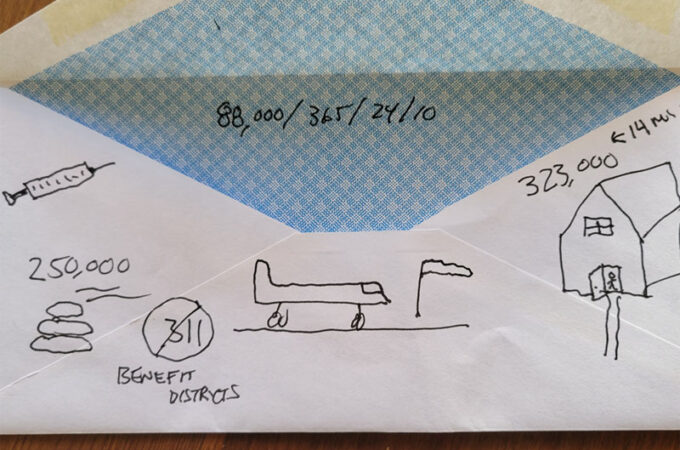
To do my back-of-the-envelope calculations, I needed to know the number of flights over the expected lifespan of the repairs. I dug around and found that the “official” number is about 88,000 take offs and landings per year. Counting take offs and landings seems to make sense because both cause wear and tear on the pavement.
But 88,000? That seems high. My local airport has a single runway. It isn’t served by any major airline. In fact, there are no commercial passenger flights in or out of the airport. There hasn’t been for years. And, unless you really, really like strawberries, Oxnard, CA isn’t a place you go to on purpose.
So, that 88,000 number seems high. Really high.
Let’s do the math. To hit that number, there would need to be, on average, one takeoff or landing every 6 minutes, 24 hours a day, 365 days per year. I can say with certainty that’s not happening. Not even close.
Why would they fudge the numbers? I suspect, though this is only a guess, that federal funding is somehow tied to airport traffic. If they reported what the numbers really are, it would be less likely that they’d receive federal funding or grants.
I don’t know what the number actually is, but I know for sure that the “official” number is wildly inaccurate. So, I really can’t do a per-flight analysis of what this new project is costing. And unfortunately, neither can anyone else.
Which brings me to my next example.
Double Dipping
Not too long ago, my wife and I took a road trip through southern Utah. We learned that the National Parks that charge admission have to share that money with the National Parks that don’t charge admission.
And that got me thinking about Channel Islands National Park. It’s one of those free parks. The visitor center is about 4 miles from here as the crow flies.
According to the National Park Service, 323,000 people visited the park in 2022. Hmm. That seems high. Really high.
First of all, the visitor center is at the end of a dead-end street, and it has terrible signage. It’s not like places such as Zion National Park and Yellowstone where there are signs 100 miles away pointing you in the right direction. You pretty much have to know where this place is to find it, or stumble upon it by accident.
Something else you should know is that the visitor center isn’t anything special. It’s mostly a tiny display of locally-found artifacts, a gift shop, a small garden of native plants, and a place to find information about how to get to the islands. But it is technically part of the park.
The real park is a series of islands off the coast. And there’s no magical Biden bridge you can drive on to get there. Unless you have a boat, it’s going to take you all day and at least $60 per head to get to the nearest one, which is 14 miles away.
So, that 323,000 number just isn’t reasonable.
Then I talked to my wife. That’s not strange in and of itself. I talk to her all the time. This time though, I talked to her about how park attendance is recorded. She used to volunteer at the park. And, it turns out, one of the duties assigned to volunteers is to record the number of park visitors.
Here’s how it works.
There’s a counter on the door to the visitor center that increments every time someone goes in or out. The totals are recorded each day, added up over the course of a year, and that’s the number they use to determine the number of park visitors.
Wait a minute. The counter increments every time the door is opened. I think we can safely say that everyone that opens the door to go in also opens the door to go out. So, everyone is being counted twice.
That means the official number shouldn’t be 323,000, it should be at most 160,000.
The other thing to note is that the counter can’t determine who’s going in and out the door. Every time a volunteer, or ranger, or maintenance worker, or vendor goes through the door, they’re counted.
So, the number of actual visitors is probably closer to a 10th of the not-double-counted number. But let’s be extremely generous and say it’s 20%. That would mean the real number of visitors to the park is closer to 30,000. Which is only 10% of the “official” number.
The number of visitors to our local National Park is wildly exaggerated. Which means that every statistic based on that number is useless.
Let’s do the math. What the official numbers say is that nearly 1,000 people a day randomly or mistakenly drive down a dead-end street, decide to enter the visitor center, but then never leave the building. And this happens every single day of the year. I’d hate to be the person who has to clean that bathroom.
323,000 visitors a year just doesn’t make sense. But the government accountants take the official number and plug it into their spreadsheets to determine the economic impact the park has on the local economy. And the result of that report is used to justify the annual budget for the park.
Here’s my last example:
The Streets of San Francisco
A couple of weeks ago, there was a report stating that Baltimore is the dirtiest city in America. Really? If you’re like me, you were scratching your head wondering how it can be that San Francisco isn’t at the top of the list. San Francisco came in at 19th.
How can San Francisco, the same city where someone created an app to show people where someone had pooped on the sidewalk, possibly be cleaner than Memphis, Dallas, Nashville and Charlotte? It doesn’t make sense.
Before I continue, I feel compelled to mention something. I’ve said several times that you need to be aware of someone’s bias when listening to what they have to say. So, in the interest of full disclosure, I’m going to admit that I have a bias. I really hate San Francisco.
I’ve been to San Francisco many times and have probably spent a cumulative of 6 weeks in the city over the last couple of decades. And if I never go back to San Francisco again, it will be too soon.
Now, with that out of the way, let’s continue.
To understand why San Francisco didn’t top out that list, there are a couple things you need to know. If you read the fine print, and it is really fine print, at the bottom of their infographic, you’ll see that they analyzed the number of calls to the local 311 line reporting a sanitation-related complaint. Then they calculated the number of calls per year per 100,000 people and used that result to draw their conclusions.
But here’s the problem. The sidewalk defecation problem in San Francisco is so bad that they had to turn to non-government organizations to do the cleanup work.
San Francisco has seventeen of what they call “Community Benefit Districts”. These Community Benefit Districts are run by non-profit organizations to provide a number of different services. One of which is to provide localized sanitation services. And that includes picking up hazardous waste. And hazardous waste includes human fecal matter. In other words, poop.
In fact, there’s so much poop on the streets of San Francisco they’ve had to give those requests their own code name. They call it, and I kid you not, a “code brown”.
To be fair, hazardous waste also includes needles discarded by junkies. But if your argument is based on which is worse, contaminated syringes or poop, do you really have much of an argument?
Six of these Community Benefit Districts have their own form for reporting issues. All of them have a phone number and email address residents can use to contact them directly. Requests for sanitation services that are made by directly contacting a Community Benefit District don’t use the 311 system, so they’re not counted as 311 calls.
Let’s do the math.
In one District alone, the SOMA district, there are nearly 10,000 sanitation-related requests. Per month. That’s at least 120,000 sanitation-related requests per year that aren’t counted as a 311 call. Another district reported 22,000 requests in the same time frame. That’s 142,000 sanitation-related requests from just two of San Francisco’s Community Benefit Districts. They have 15 more.
I’m guessing here, but I don’t think it’s unreasonable to think that, across all 17 of San Francisco’s Community Benefit Districts, there’s somewhere around a quarter million sanitation-related requests per year. Requests that weren’t even considered in the analysis that resulted in Baltimore being named the Dirtiest City in America.
If I were the mayor of Baltimore, I’d be pissed.
Here’s the word of advice…
And there you have it. Three examples that will, hopefully, act as a reminder to be wary of anything presented as an absolute fact. Especially if it comes from the government.
One last thing. Here’s a word of advice for the next time you’re tempted to believe any number or statistic you see online without first doing some quick back-of-the-envelope math.
Don’t.


