I saw a meme the other day. It’s supposed to be a poke at Baby Boomers because some of us happen to be against having to pay for someone else’s student loans. What it really is, is an example of manipulation of the data to evoke an emotional response by an ignorant audience.
So today, let’s dissect the meme to see if it makes sense. Spoiler alert: It doesn’t.
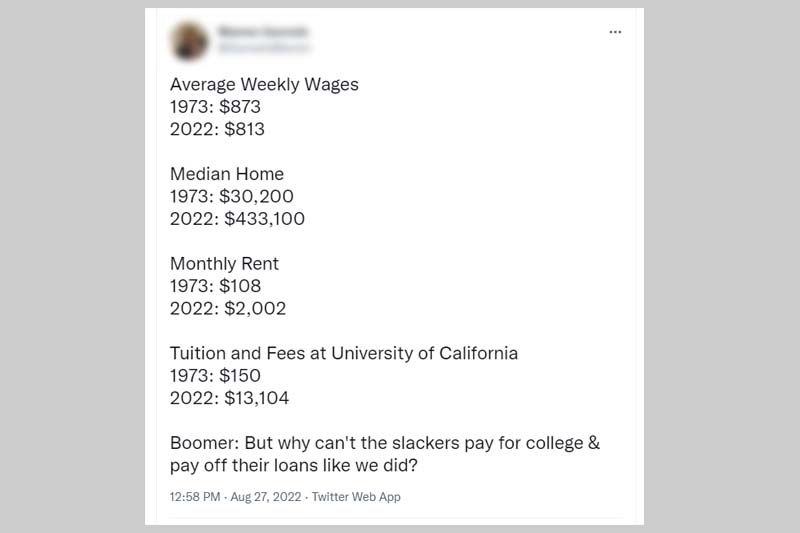
Here’s what it looks like:
First claim:
Average weekly wage in 1973 was $873. Average weekly wage in 2022 is $813.
The implication is that people are actually making, on average, less money now than an ordinary-average guy did back in 1973.
Really?
It took me about a half a second to see a problem with that. $873 per week comes to just over $45,000 per year. I happened to have been around in the 1970’s, and I can tell you that anyone making $45,000 per year was living like a king. And the claim is that $45,000 per year was “average”. With the minimum wage being less than two bucks an hour, it’s impossible that the average wage was more than 13 times that.
Oh, and one more thing, a salary of $45,000 per year in 1973, equates to earning just over $300K a year in 2022. Maybe it’s just me, but that seems high.
It took me about 10 seconds to Google “average weekly wage 1973 US” and find that it was actually around $145. Which is about 2.25 times the minimum wage at the time. Which makes much more sense.
But how did I come up with an average non-adjusted salary of $145 while the meemer came up with $873? It took me another 5 seconds to realize that the meemer was looking at a very specific subset of workers. I guess he wasn’t interested in inclusiveness that day. More likely, as you’ll find out in a bit, it’s because the real data didn’t support his agenda.
As for his 2022 average salary claim…I found slightly different numbers. But things vary so much from quarter to quarter these days, I’m willing to use the number he provided. It’s not relevant to the rest of my analysis anyway.
And besides, his assertion has bigger problems.
Because next, he proceeded to use actual average numbers for the rest of his data, which didn’t exclude anyone that wasn’t part of his specific group of workers in his database of choice.
In other words, he used one set of criteria to calculate the salary and an entirely different set of criteria to calculate the expenses.
Strike one.
Honestly, one strike is all a meemer gets. If he’s going to be purposely misleading on the very first number he presents, how likely is it that anything else that follows is going to be accurate?
Not very damn likely.
But since I’m apparently much more inclusive than he is, let’s take a look anyway. Keep in mind, since the meemer has already demonstrated a propensity for lying, or misrepresenting the data, or at least being too stupid to recognize bad data when he sees it, all of his numbers below are suspect. I’m not going to check his numbers because I don’t have to. Because there are other big-and-easy-to-find problems with his logic.
Before we can compare apples to apples, we have to adjust everything to account for inflation.
So, let’s do that.
It took me 10 more seconds to find an inflation calculator to turn 1973 dollars to 2022 dollars. Adjusting the average salary of $145 to today’s dollar, it comes out to about $967. That means that, using his numbers, the buying power of the average person in 1973 was about 19% higher than it is today.
Surprising, and probably not accurate, but not worth panicking over either.
Let’s continue.
Second claim:
Median home price in 1973 was $30,200. Median home price in 2022 is $433,100.
It turns out that paying $30,000 for a home in 1973 is about the same as paying $200,000 today. So, adjusted for inflation, the average home price in 2022 is just over twice what it was in 1973.
Sure, that’s more. But it’s not 14 times more, which is what the meemer implies.
Since we’re playing this game, we should also consider that the mortgage interest rate in 1973 was around 8% for a 30-year, fixed-rate mortgage. That’s a far cry from the sub-4% we’ve enjoyed for most of this century.
Normalizing everything to 2022 dollars, there’s about a $400 per month difference in house payments, assuming the entire purchase price is financed.
Third claim:
Monthly rent in 1973 was $108. Monthly rent in 2022 is $2,002.
First of all, I assume he meant “average monthly rent”. But what he says is that all rent everywhere was $108, which isn’t likely. Once again, using the inflation calculator, I found that when adjusting $108 to 2022 dollars, I come up with $720. So, adjusted for inflation, the average rent has increased by a factor of 2.8, not the 18.5 times the meemer implies.
Third claim:
Tuition and fees at the University of California in 1973 was $150, in 2022 it’s $13,104.
First of all, who cares? The information about California tuition is only relevant to people who have or will attend a university in California. Secondly, prior to 1970, tuition for attending the University of California was free. But only if you were a resident of California.
Non-residents, which, in 2022 applies to nearly 90% of the country, would have had to pay $1,200 in 1968. Unfortunately, data for 1968 was the closest I could find. But, since the number almost certainly isn’t less than that, I’m going to assume it’s close enough.
Adjusting 1,200 1970 dollars to 2022 dollars, we get $8,007. So, that’s a practical tuition increase of less than two times, which is a whole lot less than the 87 times implied.
It is true that, even adjusting for inflation, the cost for housing and education is greater now than it was in 1973. But it’s not nearly as bad as the meemer implies.
I keep saying “the meemer implies” because, other than quoting some incorrect numbers, he doesn’t say anything. He leaves it up to the reader to infer their own conclusions based on the information he’s supplied. His goal is to manufacture outrage and sympathy. Since he can’t do that with real information, he presents real data in such a way that it becomes misleading. Which is also known as spreading “misinformation”.
The meemer ends by pretending to quote a Baby Boomer saying, “But why can’t the slackers pay for college & pay off their loans like we did?”
The answer is easy. The slackers should be expected to pay for their tuition because they should be responsible for their own stupid decisions.
Anyone considering taking out a student loan in this century has or had the same information that was available back in the 1970’s. If anything, the people in the 70’s were working with less information. How can I be so sure? Because I was one of those people making a decision about a student loan in the 1970’s.
And I choose wisely.
I knew how about much money each profession would earn, I knew how much housing would cost, and I knew how much I’d have to borrow to go to college. And I understood how to do basic math. So, I didn’t go to college. Not then anyway.
With the possible exception of basic math skills, people in this century have access to everything I did back in the 70’s when I was considering taking out a student loan.
Even today, if I want to buy something, I still take the radical approach of first making sure I can afford it.
The equation is pretty simple. There are two main variables you need to pay attention to. The first is how much money will be going into your bank account each month (the technical term is “gozinta”), and the second is the amount you have to pay for expenses (also known as “gozouta”).
Here’s the trick: If the gozouta is more than the gozinta, then you can’t afford to do whatever you’re thinking of doing.
Inflation is calculated by comparing the current prices of a set of goods and services to previous prices. And that’s well and good over the short term. But it assumes that people are buying the same things from decade to decade. So, basic things like rent, electricity and peanut butter are used to calculate the difference between 1973 and now.
But there are a lot of things to spend money on now that just weren’t around back then. Back in the 70’s, people weren’t buying $5.00 coffees at Starbucks, they weren’t buying top-of-the-line iPhones, iPads or video games, and they weren’t paying for high-speed Internet access bundled with multiple streaming services.
I have a problem when the people who are begging for money have more and nicer things than the people they want money from.
You want me to pay for your student loans? Fine. Then show me that you’ve cut your budget to the bone and still can’t house and feed your family. Then I’ll consider it. After I’ve paid all my own bills.
Having said all this, trying to use average salaries and average expenses to make any kind of point is ridiculous. In this country, we have people making minimum wage and people making millions, if not billions of dollars a year. There are few similarities between the financial situation of someone hovering at the poverty line and someone who drives a Tesla.
This meme was posted to Facebook by someone who loves to share stuff like this along with the single word, “Perspective.” I guess it’s supposed to show how deep his thinking is, but what it really does is demonstrate his ignorance. Or laziness. Because he obviously didn’t bother to take the 25.5 seconds required to see that the meme is just a steaming pile of bullshit.
So, to everyone who wants me to pay for their student loans, I say this:
There’s an easy solution to your problem. If you gave up your daily habit of drinking $5.00 coffees at Starbucks, you’d save over $1,300 per year.
That’s more than enough to cover the increase in a house payment and pay off your own damn student loans.
And that, my friend, is perspective.